How to assign a decaying MetaScore to your users

Recently, I came across a problem statement I liked: how could we assign a single performance score to each of our users, dependent on multiple metrics, and that decays over time to return to a baseline score? Is there a simple formula we can give to developers so they implement the algorithm?
Perhaps not the best one, but I found a good enough proxy that solves our current issue:
- List all metrics you want to base your Metascore on. These metrics must be measurable and tangible enough to assign them a value per user.
- For each metric, create the formula to calculate the value per user and define three thresholds you will compare it against. A threshold value would be assigned to the “Good” scenario, another one to “Average,” and a last one to “Bad.”
- Give a factor you will use on the baseline for each metric. A factor of < 1 should diminish the score, and > 1 should increase it.
- Find a baseline you wish all users would return to after a certain period and create the product of the baseline with all maximum factors so you get the maximum score possible.
- Calculate the MetaScore for each user on a specific period you define. If there has been a change in the MetaScore, update it; if not, decrease it by its decayed value.
We list the following metrics in our use case:
| Subject | Metric | Calculus method | Bad | Average | Good | Bad | Average | Good |
|---|---|---|---|---|---|---|---|---|
| Engagement | Open Rate | total opened emails / total sent emails in the last 30 days | 10% or less | 11% - 59% | 60% or more | 1,2 | 1 | 0,9 |
| Engagement | Click-Through Rate (CTR) | total clicked emails / total sent emails in the last 30 days | 1% or less | 2% - 19% | 20% or more | 1,2 | 1 | 0,9 |
| Sending Behavior | Send Frequency | N of days at least ten emails were sent in the last 90 days | 10 or less | 11 - 44 | 45 or more | 1,2 | 1 | 0,9 |
| Infrastructure | Failed API requests | sum (403 + 422 + 429 errors) / total API calls in the last 30 days | 60% or more | 6% - 59% | 5% or less | 1,4 | 1 | 0,2 |
| Historical Behavior | Historical MetaScore | average (MetaScore in the last 30 days) | 80 or more | 11 - 79 | 10 or less | 1,4 | 1 | 0,8 |
| Client Type/Segmentation | Account Age | Number of days since user is active | Less than 10 | 11 - 30 | 31 or more | 1,4 | 1 | 0,8 |
| Client Type/Segmentation | Use case | If user selected Use Case #1 or #2 when signing up | Use Case #1 only | Both | Use Case #2 | 1 | 1 | 0,8 |
| Other | Soft bounce rate | Total soft bounced emails / total sent emails in the last 30 days | 20% or more | 4% - 19% | 3% or less | 1,2 | 1 | 0,8 |
| Other | Hard bounce rate | Total hard bounced emails / total sent emails in the last 30 days | 20% or more | 4% - 19% | 3% or less | 1,2 | 1 | 0,8 |
| Other | Spam complaint rate | Total spam complaint / total sent emails in the last 30 days | 20% or more | 2% - 19% | 1% or less | 1,4 | 1 | 0,8 |
| Other | Unsub rate | Total unsubscribed / total sent emails in the last 30 days | 20% or more | 2% - 19% | 1% or less | 1,4 | 1 | 0,8 |
So you have your MetaScore: it’s the product of each factor times the baseline.
How to decay a score to return it to a baseline?
There are multiple decay formulas, each giving the same result:
M(t) = M0 * (1 - r) * exp(t)
Where:
- M(t) is the MetaScore on a time t
- M0 is the initial MetaScore you want to get the decay for.
- r is the rate of decay ( 0 < r <1)
- t is time (time can be in years, days, (or) months; whatever you are using should be consistent throughout the problem).
This formula will decrease the MetaScore throughout time to finish at 0. It would be best to decide on the r based on the time you want the MetaScore to take to reach a specific value.
If you don’t know the decay rate but know the value you want to the MetaScore at a certain point in time, you have the following formula to get it:
r = abs ( ln ( (M(t1) / M(t0))/t1 ) )
You have the Gsheet function on C6 of this Gsheet.
Now that you have the decay formula, it is time to add the “return to baseline” part:
M(t) = (M0 - B)*exp(r * t) + B
Where:
- M(t) is the MetaScore on a time t
- M0 is the initial MetaScore you want to get the decay for.
- B is the baseline value
- r is the rate of decay ( 0 < r <1)
- t is time (time can be in years, days, (or) months; whatever you are using should be consistent throughout the problem).
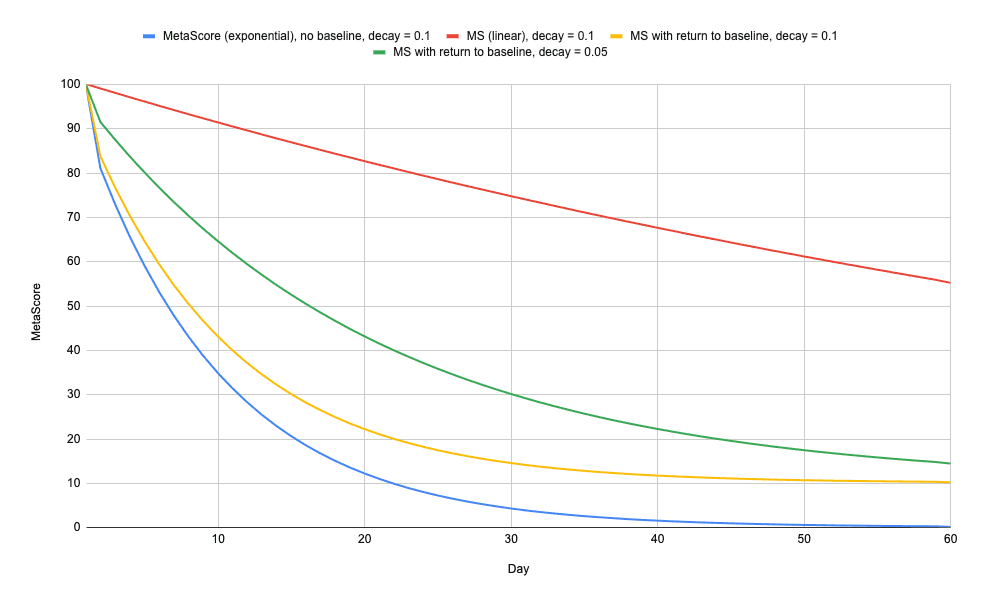
As you can see here from the graphic below, the yellow and green lines go to a baseline value of 10. You can see the details of the formula on the Gsheet linked above.

Let me know if this helped you!
